OpenShift 3.11 - Custom metric with JBoss
OpenShift 3.11 - Custom metric with JBoss
Autoscaling applications using custom metrics on OpenShift Container Platform 3.11 with JBoss EAP or Wildfly
Red Hat OpenShift Container Platform 3.11 (OCP) 은 기본적으로 CPU에 대한 애플리케이션 자동 확장을 지원합니다. 추가적으로 apis/autoscaling/v2beta1를 활성화하여 Memory의 메트릭을 기반으로 한 기능도 지원 합니다. CPU나 Memory의 경우 애플리케이션에 종속되지 않은 기본적인 메트릭이나, 때로는 추가적인 메트릭 요소를 기반으로 확장할 필요성이 있습니다.
Prometheus Adaptor를 사용하면 기본 메트릭 외에도 사용자가 지정한 애플리케이션의 메트릭을 기반으로 자동확장하는 기능을 추가 할 수 있습니다.
Prometheus Adaptor는 OCP 4.1 부터 에서 Tech Preview 대상이 되었습니다. 기능이 완전해지면 정식 지원상태로 변경 될 것입니다.
Prometheus Adaptor는 custom.metrics.k8s.io API를 구현하여 Prometheus에 연결합니다. Prometheus에서 수집되는 메트릭 기반으로 Horizontal Pod Autoscaler (HPA)가 쿼리하여 애플리케이션 메트릭을 검색할 수 있습니다.
이글은 다음의 과정을 안내 합니다.
- JBoss EAP 애플리케이션 샘플과 JMX exporter
- OCP 3.11에 Operator를 사용하여 Prometheus를 배포
- Prometheus Adapter 설정
각 내용의 상세 정보는 참고 자료의 내용이 도움이 됩니다.
준비 사항 및 조건
- OpenShift 3.11 클러스터
- 리소스 생성 권한이 있는
cluster-admin권한이 있는 계정 - 리소스 생성 방법을 포함한 OpenShift 기본 지식
- Kubernetes 에 대한 기본 지식
OpenShift 3.11 Operator 환경 구성
OpenShift Container Platform 3.11 환경에 Operator를 활성화 하기 위한 작업을 수행합니다. 기존에 이미 Operator 구성을 설치 한경우 해당 과정을 넘어갑니다.
OCP 3.11 설치를 진행한 hosts 파일의
[OSEv3:vars]항목에 다음을 추가registry.connect.redhat.com에 접속하기 위한 계정 정보가 필요
openshift_additional_registry_credentials=[{'host':'registry.connect.redhat.com','user':'<your_user_name>','password':'<your_password>','test_image':'mongodb/enterprise-operator:0.3.2'}]registry 추가를 위한 Ansible playbook 실행
$ cd /usr/share/ansible/openshift-ansible
$ ansible-playbook -i <inventory_file> playbooks/updates/registry_auth.yml
Operator framework 설치를 위한 Ansible playbook 실행
$ cd /usr/share/ansible/openshift-ansible
$ ansible-playbook -i <inventory_file> playbooks/olm/config.yml
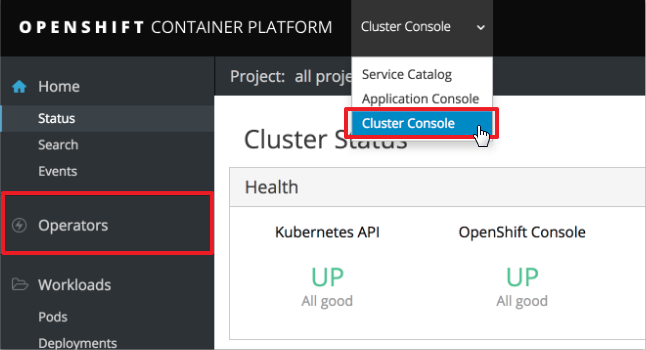
Operator framework가 설치되면 Cluster Console 에서 좌측 메뉴에 추가된 Operators 를 확인 할 수 있습니다.
애플리케이션 샘플과 JMX exporter
JMX export는 Prometheus로 Java 기반의 애플리케이션에서 수집 가능한 JMX의 mBean을 전달가능하도록 하는 수집기 입니다. Java 애플리케이션과 함께 실행되며 HTTP 엔드포인트를 노출시켜 JVM의 메트릭 정보를 제공합니다.
JMX export를 javaagent 방식으로 적용하면 애플리케이션에 별도의 수정이나 추가 코딩 없이 JMX로 수집되는 mBean 값들을 노출 시킬 수 있습니다.
다음의 샘플 애플리케이션을 기반으로 설명합니다.
https://github.com/Great-Stone/webapp
JBoss EAP 배포
애플리케이션 구조는 다음과 같습니다.
webapp
├ configuration
│	├ standalone-openshift.xml
│	└ jmx_exporter_conf.yaml
├ modules
│	└ jmx_prometheus_javaagent-0.12.0.jar
└ ROOT.war
Red Hat에서 제공되는 JBoss EAP는 S2I 빌드 배포를 지원합니다. 애플리케이션 소스 또는 바이너리를 별도의 이미지 빌드(e.g. Docker build) 없이 바로 OpenShift 상에서 사용 가능한 컨테이너 이미지로 빌드하는 기능입니다.
- root 또는 deployment 디렉토리 내의 바이너리는 JBoss EAP 의 deployments 디렉토리로 복사되어 빌드 됩니다.
- configuration 디렉토리 내의 파일은 JBoss EAP 의 configuration 디렉토리로 복사되어 빌드 됩니다. 일반적으로 JBoss EAP의 기본 standalone.xml은 해당 S2I이미지 내에서는 standalone-openshift.xml로 대체되었습니다. configuration 디렉토리에 해당 xml 파일을 위치시키면 사용자 정의 xml을 사용할 수 있습니다.
이같은 특징을 이용하여 jmx-exporter에서 읽어들일 yaml 파일인jmx_exporter_conf.yaml파일을 해당 디렉토리에 위치시켜 S2I 빌드시 빌드 이미지 내에 복사되도록 합니다. - modules 디렉토리는 JBoss에서 사용할 module 라이브러리를 추가 할 수 있도록 복사해주는 위치 입니다.
jmx_prometheus_javaagent-0.12.0.jar를 빌드 시 이미지 내부에 복사 할 수 있도록 해당 디렉토리내에 위치시킵니다.
jmx_exporter_conf.yaml
jmx_exporter_conf.yaml 에서 예시로 설정한 내용은 다음과 같습니다.
---
startDelaySeconds: 30
lowercaseOutputName: true
lowercaseOutputLabelNames: true
whitelistObjectNames:
  - "jboss.as:subsystem=request-controller"
rules:
  - pattern: "^jboss.as<subsystem=request-controller><>(active_.+|max_.+): (.*)"
    attrNameSnakeCase: true
    name: jboss_$1
    help: "jboss Request Controller : $1"
    labels:
      namespace: 'my-eap-project'
      pod: 'sample-eap'
      service: 'sample-eap'
| Name | Description |
|---|---|
| whitelistObjectNames | "jboss.as:subsystem=request-controller"의 경우 mBean 값을 기준으로 확인 가능합니다. jconsole이나 jvisualVM 툴을 사용하여 확인 가능하며, 필요시 로컬이나 리모트의 JBoss EAP / Wildfly에서 원하는 값 정의 가능 |
| pattern | mBean ObjectName의 Attribute 값의 패턴을 정의 합니다. 단일 또는 복수의 Name을 정의 가능 |
| name | jmx_exporter 에서 표기할 이름 규칙을 설정 |
| labels | OpenShift 환경에서 식별할 수 있는 label을 추가합니다. namespace, pod, service 는 기본 JMX exporter로는 수집되지 않으므로 해당 애플리케이션이 배포될 OpenShift 환경에 맞춰 설정 |
기타 상세 옵션은 다음의 url에서 확인 가능합니다.
https://github.com/prometheus/jmx_exporter#configuration
JBoss EAP / Wildfly 배포
OpenShift Application Console에서 작업 진행
배포 할 프로젝트를 생성 (e.g. my-eap-project)
해당 프로젝트를 선택 후 좌측 메뉴의 Catalog를 선택
JBoss EAP 7.2를 선택- Information
Next>클릭 - Configuration (앞서
jmx_exporter_conf.yaml의 레이블 설정 참고)- Application Name: sample-eap
- Git Repository URL: https://github.com/Great-Stone/webapp.git
- Git Reference: master
- Context Directory: (Blank)
- Labels
- app : sample-eap
Create버튼 클릭
- Results
- 생성 확인 후
Close버튼 클릭
- 생성 확인 후
- Information
좌측 메뉴에서
Builds클릭 후 생성한sample-eap확인좌측 메뉴에서
Applications>Deployments클릭 후 생성된 Deployment Configsample-eap클릭Environment 탭을 선택하고 다음을 추가하고 하단
Save버튼 클릭Name Value JAVA_OPTS_APPEND -javaagent:/opt/eap/modules/jmx_prometheus_javaagent-0.12.0.jar=58080:/opt/eap/standalone/configuration/jmx_exporter_conf.yaml JAVA_OPTS_APPEND환경 변수에 값을 기입하면 해당 JBoss EAP 7.2 S2I 빌드 시 실행되는 서버의 Java Option 값 뒤에 해당 값이 추가됨javaagent로 빌드시 해당 컨테이너 이미지 내부로 복사된modules디렉토리의jmx_prometheus_javaagent-0.12.0.jar를 지정하고=58080은 엔드포인트 포트를 정의추가로 컨테이너 이미지 내부로 복사된
configuration디렉토리의 설정 파일인jmx_exporter_conf.yaml을 정의
우측 상단의
Actions>Edit YAML을 클릭하여spec > template > metadata > annotations에prometheus.io/scrape: 'true'를 추가하고 하단의Save버튼 클릭apiVersion: apps.openshift.io/v1 kind: DeploymentConfig ... spec: ... template: metadata: annotations: prometheus.io/scrape: 'true' creationTimestamp: null ...
좌측 메뉴에서
Applications>Services클릭 후 생성된 Servicesample-eap클릭우측 상단의
Actions>Edit YAML을 클릭하여prometheus.io/scrape: "true"항목과 export를 위한 port를 추가하고 하단Save버튼을 클릭하여 저장합니다. port는 eap를 위한 서비스를 위한 port와 exporter를 위한 port 두개가 필요함apiVersion: v1 kind: Service metadata: annotations: description: The web server's http port. prometheus.io/scrape: 'true' ... spec: ... ports: - name: eap port: 8080 protocol: TCP targetPort: 8080 - name: exporter port: 58080 protocol: TCP targetPort: 58080 ...Service에 새로운 포트를 추가하면 기존 route를 올바른 포트에 연결하고, exporter의 데이터 확인을 위한 새로운 route를 다음 단계에서 추가
좌측 메뉴에서
Applications>Routes클릭 후 생성된 routesample-eap클릭- 우측 상단의
Actions>Edit을 클릭 하고Target Port를8080→8080(TCP)임을 확인 후 하단Save버튼 클릭 - 다시 Routes 목록 화면으로 이동하여 우측 상단의
Create Route클릭하여 다음을 설정하고 하단Save버튼 클릭- Name: sample-eap-exporter
- Target Port: 58080→58080(TCP)
- Security(선택사항)
- Secure route: Checked
- TLS Termination: Edge
- Insecure Traffic: None
- 우측 상단의
JMX exporter가 적용되었는지 확인을 위해 사로 생성한
sample-eap-exporter의 Hostname을 클릭하여 정보 확인... # HELP jboss_active_requests jboss Request Controller : active_requests # TYPE jboss_active_requests untyped jboss_active_requests{namespace="my-eap-project",pod="sample-eap",service="sample-eap",} 0.0 # HELP jboss_max_requests jboss Request Controller : max_requests # TYPE jboss_max_requests untyped jboss_max_requests{namespace="my-eap-project",pod="sample-eap",service="sample-eap",} -1.0 ...jmx_exporter_conf.yaml에서 정의한 JMX 내용이 표기되는지 확인- 예제에서는
jboss_를 prefix로 정의하였고active_*,max_*항목의 Attribute 데이터를 표기 - 데이터의 label인 namespace, pod, service가 표기되는지 확인
Setting up Prometheus
Operator framework를 활용하여 애플리케이션을 모니터링 하도록 설정할 수 있습니다. 각 yaml로 작성된 설정은 CLI 또는 OpenShift Console 상에서 진행 할 수 있습니다. 적용하는 각 방법은 OpenShift에 리소스 배포 를 참고하세요.
Prometheus 구성요소를 배포하기 위해 프로젝트를 구성합니다. 여기서는 custom-metric 프로젝트에서 진행합니다.
1) Operator subscription 생성
$ oc create -f - <<EOF
apiVersion: operators.coreos.com/v1alpha1
kind: Subscription
metadata:
  generateName: prometheus-
  namespace: custom-metric
spec:
  source: rh-operators
  name: prometheus
  startingCSV: prometheusoperator.0.22.2
  channel: preview
EOF
2) Service monitor 생성
oc apply -f - <<EOF
apiVersion: monitoring.coreos.com/v1
kind: ServiceMonitor
metadata:
  name: sample-app
  labels:
    app: sample-app
  namespace: prometheus-metric
spec:
  selector:
    matchLabels:
      app: sample-app
    namespaceSelector:
      matchNames:
        - my-eap-project
  endpoints:
    - port: exporter
EOF
3) Prometheus Operator가 제공하는 사용자 정의 오브젝트 생성
oc apply -f - <<EOF
apiVersion: monitoring.coreos.com/v1
kind: Prometheus
metadata:
  name: example
  labels:
    prometheus: k8s
  namespace: prometheus-metric
spec:
  replicas: 1
  version: v2.3.2
  serviceAccountName: prometheus-k8s
  securityContext: {}
  serviceMonitorSelector:
    matchLabels:
      app: sample-app
EOF
4) Prometheus Adapter가 쿼리 할 수 있도록 Prometheus Pod를 서비스를 작성
$ oc apply -f - <<EOF
apiVersion: v1
kind: Service
metadata:
  name: prometheus
spec:
  ports:
  - name: web
    port: 9090
    protocol: TCP
    targetPort: web
  selector:
    prometheus: example
EOF
Prometheus Adapter setup
Prometheus가 설정된 상태에서 다음 리소스에 대한 설정을 추가하여 Prometheus Adopter 설정합니다. RBAC 접근제어, Adapter 구성, API 확장, Deployment 항목들이 포함되어있습니다.
kind: ServiceAccount
apiVersion: v1
metadata:
  name: custom-metrics-apiserver
  namespace: prometheus-metric
---
apiVersion: rbac.authorization.k8s.io/v1
kind: ClusterRole
metadata:
  name: custom-metrics-server-resources
rules:
- apiGroups:
  - custom.metrics.k8s.io
  resources: ["*"]
  verbs: ["*"]
---
apiVersion: rbac.authorization.k8s.io/v1
kind: ClusterRole
metadata:
  name: custom-metrics-resource-reader
rules:
- apiGroups:
  - ""
  resources:
  - namespaces
  - pods
  - services
  verbs:
  - get
  - list
---
apiVersion: rbac.authorization.k8s.io/v1
kind: ClusterRoleBinding
metadata:
  name: custom-metrics:system:auth-delegator
roleRef:
  apiGroup: rbac.authorization.k8s.io
  kind: ClusterRole
  name: system:auth-delegator
subjects:
- kind: ServiceAccount
  name: custom-metrics-apiserver
  namespace: prometheus-metric
---
apiVersion: rbac.authorization.k8s.io/v1
kind: RoleBinding
metadata:
  name: custom-metrics-auth-reader
  namespace: kube-system
roleRef:
  apiGroup: rbac.authorization.k8s.io
  kind: Role
  name: extension-apiserver-authentication-reader
subjects:
- kind: ServiceAccount
  name: custom-metrics-apiserver
  namespace: prometheus-metric
---
apiVersion: rbac.authorization.k8s.io/v1
kind: ClusterRoleBinding
metadata:
  name: custom-metrics-resource-reader
roleRef:
  apiGroup: rbac.authorization.k8s.io
  kind: ClusterRole
  name: custom-metrics-resource-reader
subjects:
- kind: ServiceAccount
  name: custom-metrics-apiserver
  namespace: prometheus-metric
---
apiVersion: rbac.authorization.k8s.io/v1
kind: ClusterRoleBinding
metadata:
  name: hpa-controller-custom-metrics
roleRef:
  apiGroup: rbac.authorization.k8s.io
  kind: ClusterRole
  name: custom-metrics-server-resources
subjects:
- kind: ServiceAccount
  name: horizontal-pod-autoscaler
  namespace: prometheus-metric
---
apiVersion: v1
kind: ConfigMap
metadata:
  name: adapter-config
  namespace: prometheus-metric
data:
  config.yaml: |
    rules:
    - seriesQuery: '{__name__="jboss_active_requests",namespace!="",pod!=""}'
      resources:
        overrides:
          namespace: {resource: "namespace"}
          pod: {resource: "pod"}
          service: {resource: "service"}
      name:
        matches: "^(.*)_requests"
        as: "${1}_avg"
      metricsQuery: '<<.Series>>{<<.LabelMatchers>>}'
---
apiVersion: v1
kind: Service
metadata:
  annotations:
    service.alpha.openshift.io/serving-cert-secret-name: prometheus-adapter-tls
  labels:
    name: prometheus-adapter
  name: prometheus-adapter
  namespace: prometheus-metric
spec:
  ports:
  - name: https
    port: 443
    targetPort: 6443
  selector:
    app: prometheus-adapter
  type: ClusterIP
---
apiVersion: apiregistration.k8s.io/v1beta1
kind: APIService
metadata:
  name: v1beta1.custom.metrics.k8s.io
spec:
  service:
    name: prometheus-adapter
    namespace: prometheus-metric
  group: custom.metrics.k8s.io
  version: v1beta1
  insecureSkipTLSVerify: true
  groupPriorityMinimum: 100
  versionPriority: 100
---
apiVersion: apps/v1
kind: Deployment
metadata:
  labels:
    app: prometheus-adapter
  name: prometheus-adapter
  namespace: prometheus-metric
spec:
  replicas: 1
  selector:
    matchLabels:
      app: prometheus-adapter
  template:
    metadata:
      labels:
        app: prometheus-adapter
      name: prometheus-adapter
    spec:
      serviceAccountName: custom-metrics-apiserver
      containers:
      - name: prometheus-adapter
        image: directxman12/k8s-prometheus-adapter-amd64
        args:
        - --secure-port=6443
        - --tls-cert-file=/var/run/serving-cert/tls.crt
        - --tls-private-key-file=/var/run/serving-cert/tls.key
        - --logtostderr=true
        - --prometheus-url=http://prometheus-operated:9090/
        - --metrics-relist-interval=1m
        - --v=4
        - --config=/etc/adapter/config.yaml
        ports:
        - containerPort: 6443
        volumeMounts:
        - mountPath: /var/run/serving-cert
          name: volume-serving-cert
          readOnly: true
        - mountPath: /etc/adapter/
          name: config
          readOnly: true
        - mountPath: /tmp
          name: tmp-vol
      volumes:
      - name: volume-serving-cert
        secret:
          secretName: prometheus-adapter-tls
      - name: config
        configMap:
          name: adapter-config
      - name: tmp-vol
        emptyDir: {}
RBAC의 정의는 Adopter가 동작하는데 필요한 ServiceAccount, ClusterRole, RoleBinding, ClusterRoleBinding 을 작성합니다.
Prometheus 수집 확인
Prometheus 구성이 배포된
prometheus-metric프로젝트에서 수행좌측 Overview 클릭 후 목록에서
prometheus-example의 route 클릭하여 Prometheus Console 확인Execute우측의-insert metric at cursor-목록에서 추가된jboss_active_requests항목 선택 후Execute클릭 하여 값 확인Element Value jboss_active_requests 0 - namespace, pod, service는
jmx_exporter_conf.yaml에서 부여 한 값 - 기본 jmx-exporter의 경우 pod 정보를 동적으로 가져올 수 없음
- namespace로 메트릭을 확인
- namespace, pod, service는
Test automatic scaling
Adopter가 애플리케이션 Metric을 검색할 수 있는지 확인하여 정상적으로 동작하고 있는지 확인이 필요합니다.
Adopter가 애플리케이션 Metric 정보를 검색하도록 구성되었는지 확인
$  oc get --raw "/apis/custom.metrics.k8s.io/v1beta1" | jq .
{
  "kind": "APIResourceList",
  "apiVersion": "v1",
  "groupVersion": "custom.metrics.k8s.io/v1beta1",
  "resources": [
    {
      "name": "namespaces/jboss_active_avg",
      "singularName": "",
      "namespaced": false,
      "kind": "MetricValueList",
      "verbs": [
        "get"
      ]
    },
    {
      "name": "pods/jboss_active_avg",
      "singularName": "",
      "namespaced": true,
      "kind": "MetricValueList",
      "verbs": [
        "get"
      ]
    },
    {
      "name": "services/jboss_active_avg",
      "singularName": "",
      "namespaced": true,
      "kind": "MetricValueList",
      "verbs": [
        "get"
      ]
    }
  ]
}
애플리케이션 Metric인
jboss_active_avg가 검색되는 지 확인$ oc get --raw "/apis/custom.metrics.k8s.io/v1beta1/namespaces/my-eap-project/metrics/jboss_active_avg" | jq . { "kind": "MetricValueList", "apiVersion": "custom.metrics.k8s.io/v1beta1", "metadata": { "selfLink": "/apis/custom.metrics.k8s.io/v1beta1/namespaces/my-eap-project/metrics/jboss_active_avg" }, "items": [ { "describedObject": { "kind": "Namespace", "name": "my-eap-project", "apiVersion": "/v1" }, "metricName": "jboss_active_avg", "timestamp": "2020-01-30T07:12:01Z", "value": "3", "selector": null } ] }결과 값은 JBoss 상의 Active Request가 3개임을 의미 합니다.
Horizontal Pod Autoscaler (HPA) 리소스를 적용합니다.
$ oc apply -f - <<EOF kind: HorizontalPodAutoscaler apiVersion: autoscaling/v2beta1 metadata: name: sample-eap namespace: my-eap-project spec: scaleTargetRef: apiVersion: apps.openshift.io/v1 kind: DeploymentConfig name: sample-eap minReplicas: 1 maxReplicas: 5 metrics: - type: Object object: target: kind: Namespace name: my-eap-project metricName: jboss_active_avg targetValue: 10 EOFnamespace를 기준으로 쿼리하기 때문에Object형태의 metrics를 구성합니다.적용된 HPA를 확인하여 적용된 JBoss EAP에 요청에 따라 값이 변화하고 Pod의 수가 변화하는지 확인합니다.
$ watch oc describe hpa/sample-eap -n my-eap-project
Every 2.0s: oc describe hpa/sample-eap -n my-eap-pr...  Thu Jan 30 07:23:47 2020

Name:                                              sample-eap
Namespace:                                         my-eap-project
Labels:                                            <none>
Annotations:                                       kubectl.kubernetes.io/last-ap
plied-configuration={"apiVersion":"autoscaling/v2beta1","kind":"HorizontalPodAut
oscaler","metadata":{"annotations":{},"name":"sample-eap","namespace":"my-eap-pr
oject"},"sp...
CreationTimestamp:                                 Thu, 30 Jan 2020 07:18:17 +00
00
Reference:                                         DeploymentConfig/sample-eap
Metrics:                                           ( current / target )
  "jboss_active_avg" on Namespace/my-eap-project:  16 / 10
Min replicas:                                      1
Max replicas:                                      5
DeploymentConfig pods:                             1 current / 2 desired
Conditions:
  Type            Status  Reason              Message
  ----            ------  ------              -------
  AbleToScale     True    SucceededRescale    the HPA controller was able to upd
ate the target scale to 2
  ScalingActive   True    ValidMetricFound    the HPA was able to successfully c
alculate a replica count from Namespace metric jboss_active_avg
  ScalingLimited  False   DesiredWithinRange  the desired count is within the ac
ceptable range
Events:
  Type    Reason             Age   From                       Message
  ----    ------             ----  ----                       -------
  Normal  SuccessfulRescale  17s   horizontal-pod-autoscaler  New size: 2; reaso
n: Namespace metric jboss_active_avg above target
Appendix
1. 참고 자료
- https://medium.com/ibm-cloud/autoscaling-applications-on-openshift-container-platform-3-11-with-custom-metrics-6e9c14474de3
- Sample app (github) : https://github.com/Great-Stone/webapp
- s2i-wildfly : https://github.com/openshift-s2i/s2i-wildfly
- rhpam prometheus 참고 : https://github.com/DuncanDoyle/rhpam-prometheus-grafana-ocp
- jmx exporter : https://github.com/prometheus/jmx_exporter
- jmx exporter for JBoss/Wildfly : https://lazarbulic.com/blog/2018/05/25/prometheus-jmx_exporter-for-jboss-wildfly/
- Prometheus Query : https://prometheus.io/docs/prometheus/latest/querying/basics/
- OpenShift k8s-prometheus-adapter (github) : https://github.com/openshift/k8s-prometheus-adapter
- Horizontal Pod Autoscaler : https://kubernetes.io/docs/tasks/run-application/horizontal-pod-autoscale/
- Exposing custom application metrics for autoscaling OCP 4.1~ : https://docs.openshift.com/container-platform/4.3/monitoring/exposing-custom-application-metrics-for-autoscaling.html
- Installing the Operator Framework OCP 3.11 : https://docs.openshift.com/container-platform/3.11/install_config/installing-operator-framework.html
2. Memory based HPA
다음의 정보가 도움이 됩니다. :
v2beta1 api를 적용하는 방법은 다음과 같습니다.
master 노드의
master-config.yaml수정$ vi /etc/origin/master/master-config.yamlapiServerArguments에runtime-config항목으로apis/autoscaling/v2beta1=true추가kubernetesMasterConfig: ... apiServerArguments: ... runtime-config: - apis/autoscaling/v2beta1=true controllerArguments: ...master 구성요소 재시작
$ master-restart api
$ master-restart controllers
$ systemctl restart atomic-openshift-node.service
api 응답 확인
$ oc get --raw /apis/autoscaling/v2beta1
{"kind":"APIResourceList","apiVersion":"v1","groupVersion":"autoscaling/v2beta1","resources":[{"name":"horizontalpodautoscalers","singularName":"","namespaced":true,"kind":"HorizontalPodAutoscaler","verbs":["create","delete","deletecollection","get","list","patch","update","watch"],"shortNames":["hpa"],"categories":["all"]},{"name":"horizontalpodautoscalers/status","singularName":"","namespaced":true,"kind":"HorizontalPodAutoscaler","verbs":["get","patch","update"]}]}
HPA 적용 :
예를들어mnist-app이라고 하는DeploymentConfig를 타겟으로 함apiVersion: autoscaling/v2beta1 kind: HorizontalPodAutoscaler metadata: name: mnist-app namespace: my-namespace spec: maxReplicas: 10 minReplicas: 1 scaleTargetRef: apiVersion: apps.openshift.io/v1 kind: DeploymentConfig name: mnist-app metrics: - type: Resource resource: name: memory targetAverageUtilization: 10 - type: Resource resource: name: memory targetAverageValue: 1G- targetAverageUtilization : Pod 들의 가용한 Memory를 100으로 산정하여 그중 사용량을 기준
- targetAverageValue : Pod 들의 평균 사용량을 기준
3. Registry account
Red Hat Container Image Registry에 접속하기 위한 전용 계정을 생성할 수 있습니다.
- https://registry.redhat.io 에 접속하여 로그인
- 우측 상단의
Service Accounts를 클릭 New Service Account버튼을 클릭- Create a New Registry Service Account
- Name : "A-z 0-9 .-_" 조건에 맞는 이름을 설정 (e.g. registry)
- Description : 해당 계정 정보에 대한 설명을 기입 (e.g. for image registry login)
CREATE버튼 클릭
- 생성된 Token Information 확인
Token Information탭의 정보를 확인- Username is 00000000|registry and... 설명의 숫자+파이프+이름 형태가 Username
- 아래 Token 값(매우 긴)이 Password 로 동작
생성한 Token으로 본래의 계정 접속 정보를 노출 하지 않고 Red Hat Container Image Registry에 접속할 수 있는 접속 정보로 사용할 수 있습니다.
4. OpenShift에 리소스 배포
OpenShift에 리소스를 배포하는 방법은 oc CLI를 사용하는 방법과 Application Console을 활용하는 두가지 방법이 있습니다.
다음과 같은 prometheus-operator관련 리소스 설정이 있다고 가정합니다.
apiVersion: operators.coreos.com/v1alpha1
kind: Subscription
metadata:
  generateName: prometheus-
  namespace: custom-metric
spec:
  source: rh-operators
  name: prometheus
  startingCSV: prometheusoperator.0.22.2
  channel: preview
yaml로 작성된 리소스 설정 파일을 적용하기위해 다음 두가지 형태를 활용합니다.
1) CLI 활용
oc 로그인 상태에서 yaml로 작성된 리소스 설정을 파일로 저장합니다. 예를 들어 prometheus-operator.yaml 인 경우 다음과 같이 적용 가능합니다.
$ oc apply -f prometheus-operator.yaml
또는 다음과 같이 인라인으로 수행할 수 있습니다.
$ $ oc create -f - <<EOF
apiVersion: operators.coreos.com/v1alpha1
kind: Subscription
metadata:
  generateName: prometheus-
  namespace: custom-metric
spec:
  source: rh-operators
  name: prometheus
  startingCSV: prometheusoperator.0.22.2
  channel: preview
EOF
2) Application Console 활용
OpenShift Application Console 에 접속 합니다. 적용할 프로젝트를 클릭하고 Overview 화면의 우측 상단에 Add to Project를 클릭합니다.Import YAML/JSON을 클릭하여 리소스 설정을 입력받는 창에 앞서의 예로 작성된 설정을 붙여넣습니다. 또는 파일로 저장된 파일을 선택하여 업로드/적용 가능합니다. Create 버튼을 클릭하여 결과를 확인합니다.